Cloudwatch is a monitoring service from AWS. By default, cloud watch is enabled for your ec2 instances which monitor your instances every five minutes. You can also enable detailed monitoring (Costs extra money ) which monitors your instances every one minute.
Cloudwatch Metrics:
Cloudwatch let you monitor your instances using metrics. Following are the few metrics available. It is not limited to those, you can get metrics of other services as well.
- EBS Metrics
- EC2 Metrics
- S3 Metrics
Following are the metrics available for ec2.
- CPU Utilization/Credits
- Network In/Out
- Disk read/write
- Status Checks
Following are the metrics available for S3
- No of objects
- Bucket size
EBS has many metrics like read, write, queue length etc.
Using these metrics you can create monitoring dashboards with widgets displaying graphs and text data.
[alert-announce]
RECOMMENDED COURSES
AWS Certified Solutions Architect (2018)
AWS Certified Developer Associate level (2018)
AWS Certified SysOps Administrator Associate (2018)
[/alert-announce]
Cloudwatch Events
This is basically an event notifier for your AWS resources. You can set event notifiers like when an ec2 instance is in running state notify the lambda function to notify DNS entries.
Cloudwatch Logs
This option lets you aggregate system logs or application logs on cloudwatch and process it. To do this you need to install an agent on your ec2 instance and set a role to write permissions to cloudwatch logs.
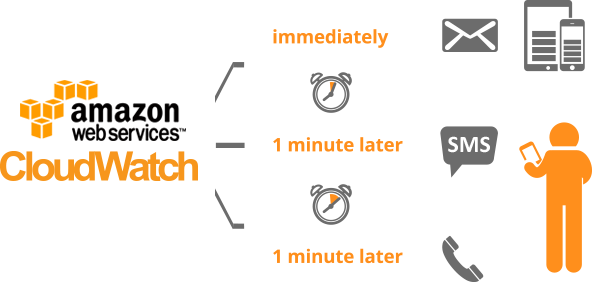
Cloudwatch Alarms
You can set specific alarms based on available cloudwatch metrics. Once such example is an alarm to notify CPU utilization. You can set up an alarm with an SNS topic to receive alerts on your email address.
Based on alarm you can also set autoscaling actions (scaling up or down) or an ec2 instance action (stop, reboot or terminate)
Key Points
- Default standard monitoring is 5 minutes and detailed monitoring is 1 minute.
- Alarms are for threshold notifications.
- Event for AWS resource even event notification
- Custom log analysis using cloudwatch logs.